— PROJECT COMPANIES
- Google Fiber
- Minnesota Transport
- Athens Airbnb
— ROLE
Business Intelligence
— DATE
2024
Laid out below are the Google business intelligence projects that I have carried out using SQL, Big Query and Tableau. This involved data modelling, analysis, screens and custom dashboards for an end client.
The projects cover these areas:
Google Fiber customer service problem resolution
Minnesota Traffic Department interstate infrastructure resolution
Airbnb Athens accommodation hotspots and pricing
Tools
I intensively used the Google data warehouse tool BigQuery, SQL and the Salesforce visualisation software Tableau Public.

Process: CAM
Business Intelligence Process stages
CAPTURE
ANALYSE
MONITOR

Projects
As part of Google training I carried out 3 Google business intelligence projects in early 2024. These projects covered these areas –
- Google Fiber customer service repeat calls pattern resolution covering key markets and key problems types and trends, covering problems resolution.
- Minnesota Transportation Department interstate traffic volume and patterns. Trends in travel over time periods, national holidays and under weather patterns.
- Airbnb Accommodation hotspots and pricing. Trends in vacancies, areas and costs.
Google Fiber

Background
About the company
Google Fiber/GFiber is a high-speed broadband internet service that uses fiber optic cable, and wave tech to deliver fast internet right to homes and businesses.
Started by Google, Google Fiber Inc. is now a subsidiary of Alphabet and services a growing number of households in 13 cities in 10 states across the United States. In 2024, Google Fiber is estimated to deliver internet to about 4.1 million people.
Products
Residential and business internet provider, with broadband services with both fiber-optic and fixed wireless technology. Customer service department focus for this project.
Scenario
Google business intelligence:
The stakeholder is the Google Fiber Customer Service Team. The team needs to understand how often customers phone customer support again after their first inquiry; this will help leaders understand whether the team is able to answer customer questions the first time.
Further, leaders want to explore trends in repeat calls to
identify why customers are having to call more than once, as well as how to
improve the overall customer experience. I will create a dashboard to reveal
insights about repeat callers.
Problem Statement
The team wants to answer these questions:
- - How often does the customer service team receive repeat calls from customers?
- - What problem types generate the most repeat calls?
- - Which market city’s customer service team receives the most repeat calls?
Business Case
- Understanding repeat calls helps to pinpoint a plethora of issues.
- Firstly understand volumes and the landscape
- Understand the problem major issues causing calls
- See which customer teams are carrying which calls
- Improve resolution to increase customer satisfaction
- Increase training and resources to increase not only first call resolution but also product satisfaction.
- Motivate staff
- Feed the information back to product and documentation teams
- Update FAQs
Goals/Metrics
The team’s ultimate goal is to reduce call volume by increasing customer satisfaction and improving operational optimization. My dashboard should demonstrate an understanding of this goal and provide stakeholders with insights about repeat caller volumes in different markets and the types of problems they represent.
Dashboard Dataset
The project data consisted of 3 separate datasets. These were imported into Big Query, checked and via Union All were combined into one dataset. This CSV dataset was then imported into Tableau for visualisation.
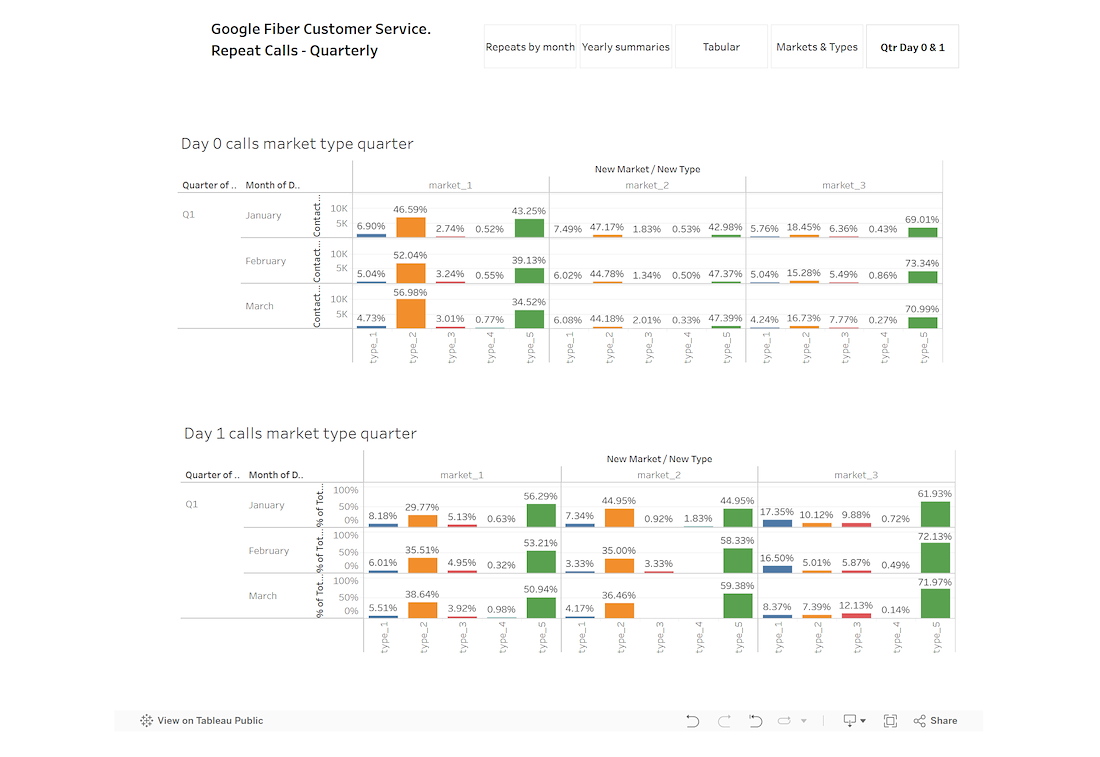
Dashboard and results
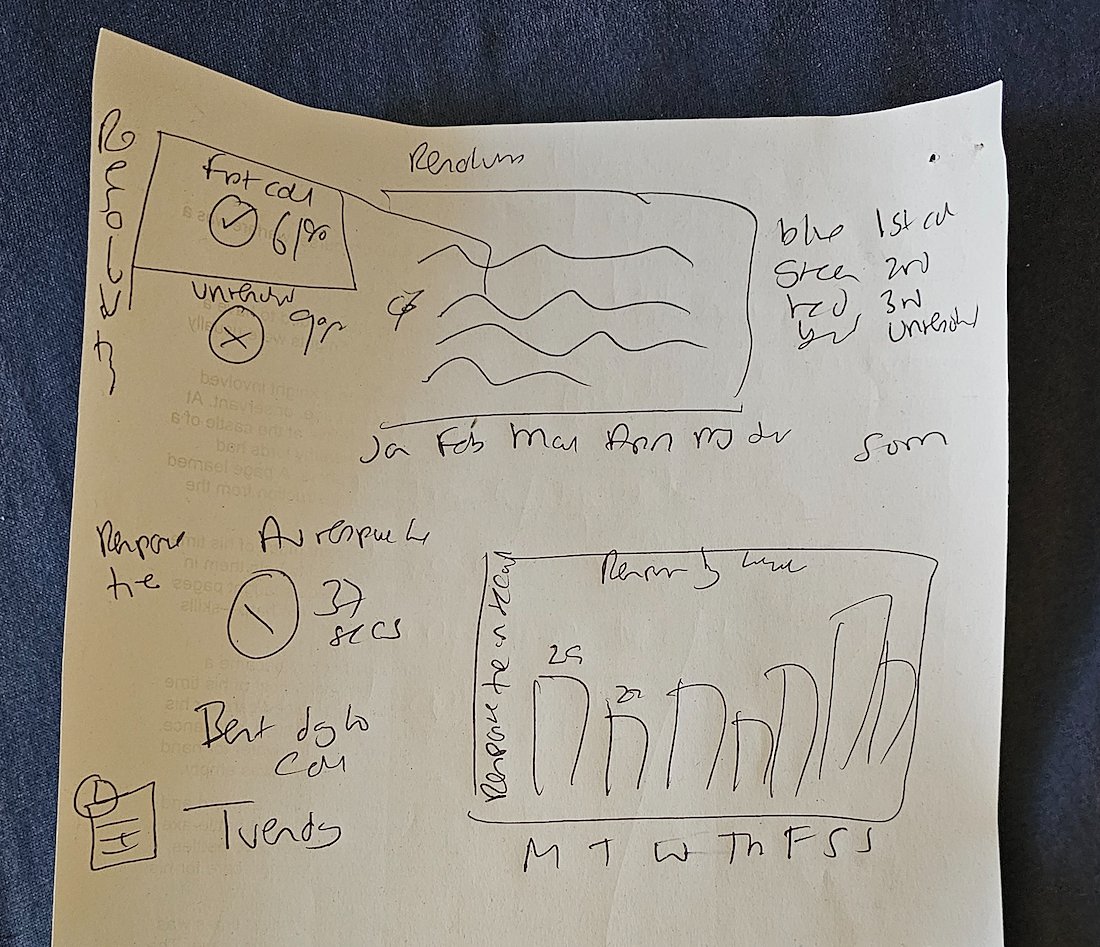
As an early project I decided to give a give a multi set dashboard. This combined not only a day of the week and weekly operational level but also an annual level. This makes it easy for all levels to see what is happening at several different points. Monthly and annual results are quite different.
The client can then pick options and allocate levels. I anticipate that the annual page would not be available for some users.
See also the executive summary.
The dashboard and executive summary can be seen below.
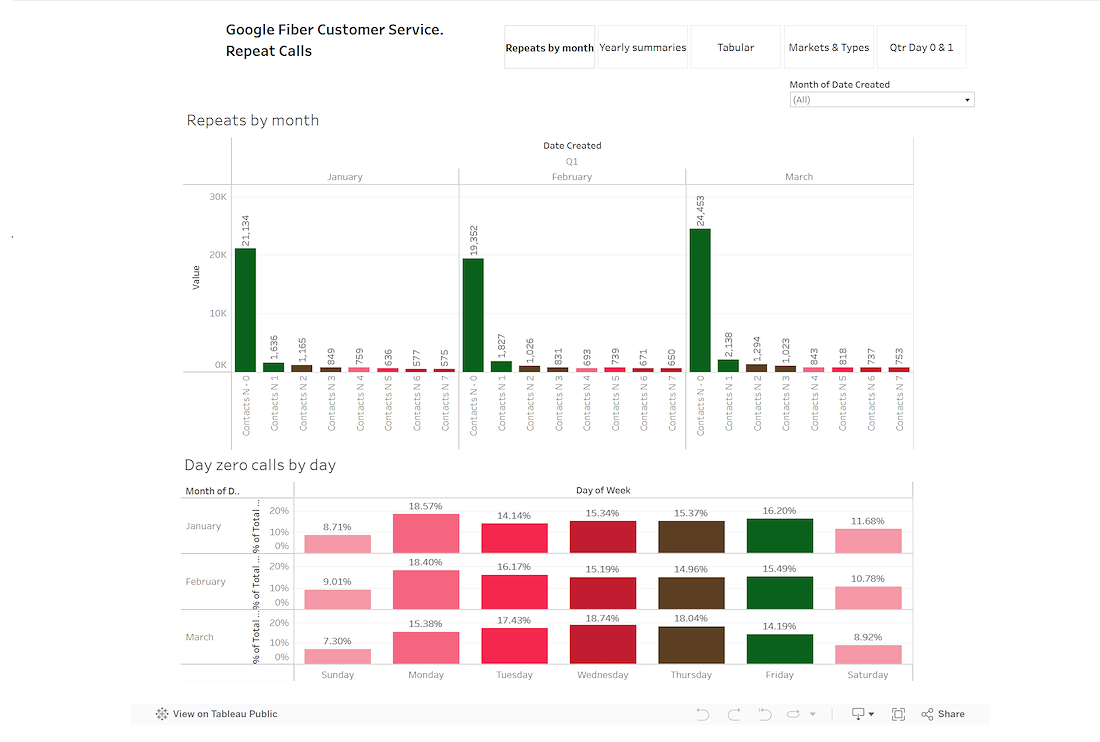
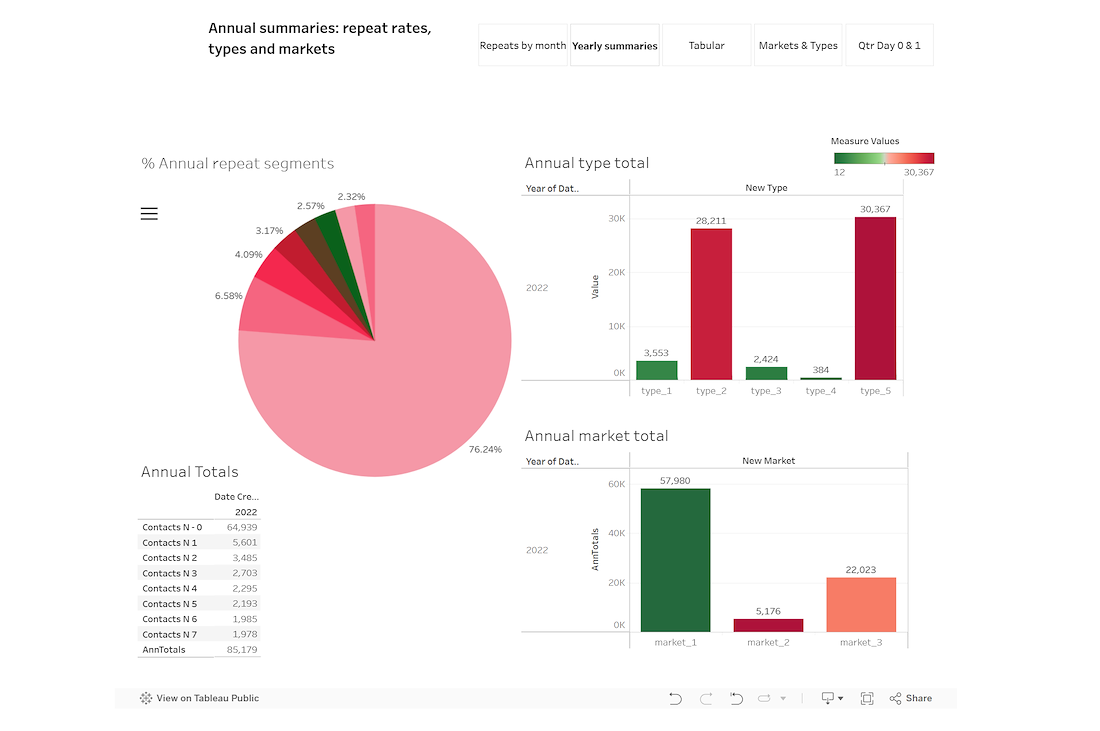
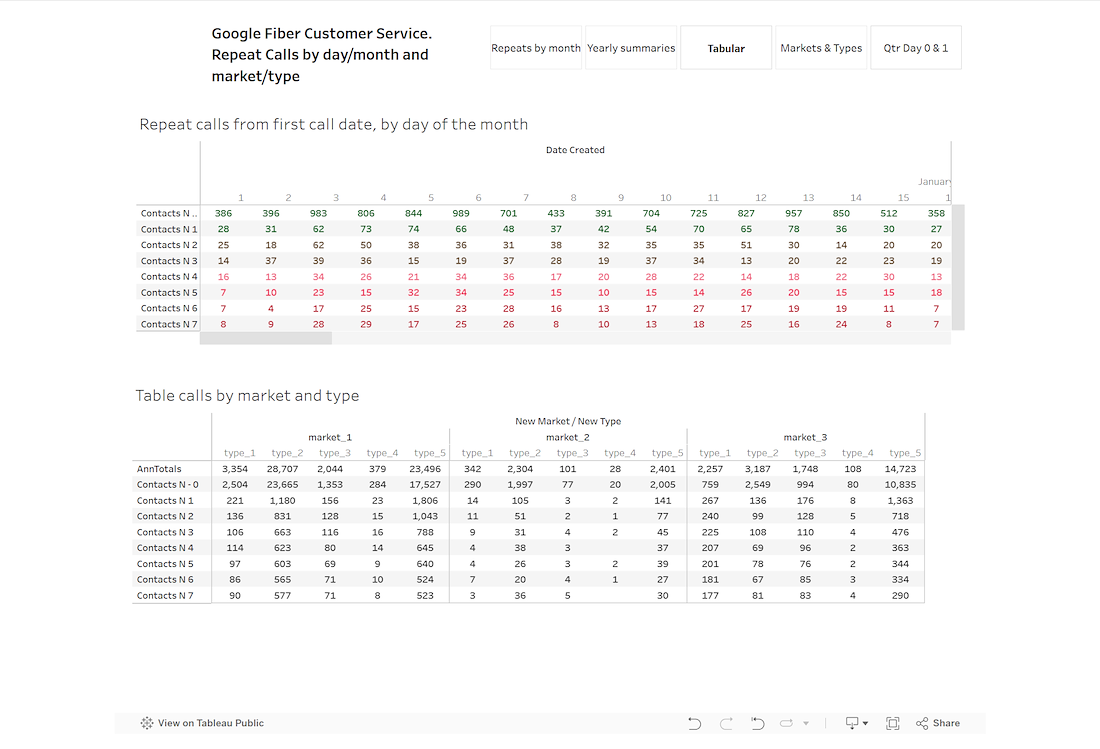
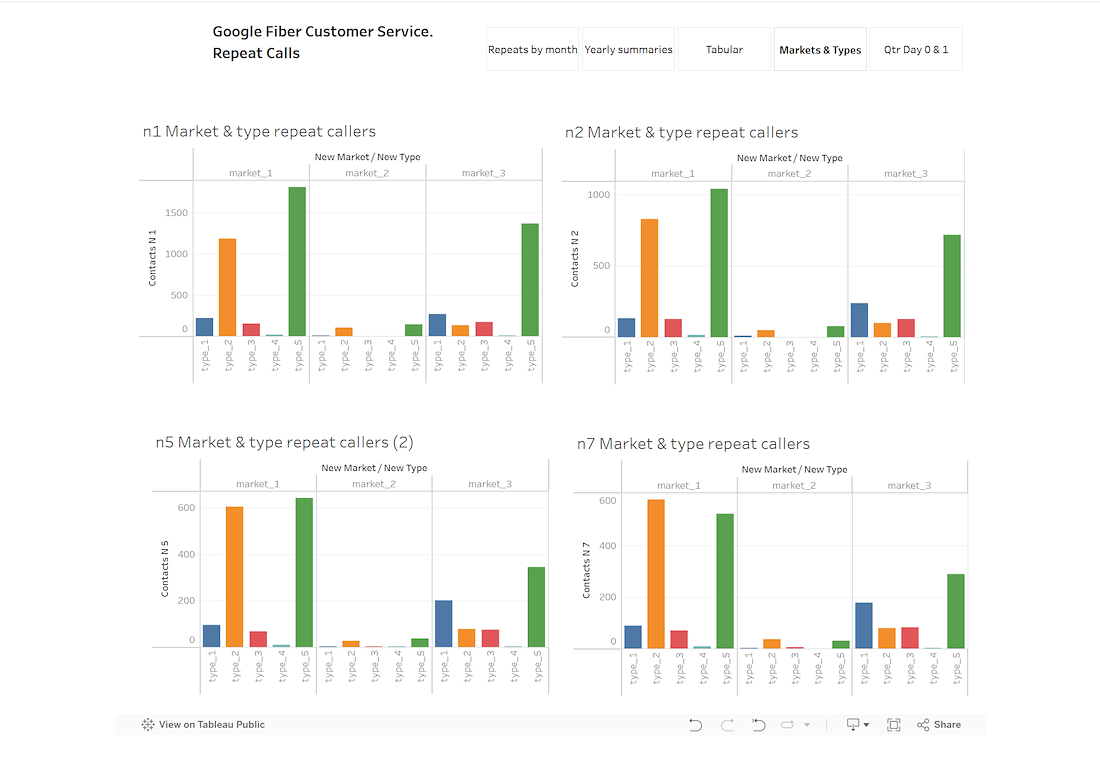
/background(fff)/1100x1426.jpeg?auto=webp)
Minnesota Traffic Patterns
Background
About the company
The Minnesota Department of Transportation oversees transportation by all modes including land, water, air, rail, walking and bicycling in the U.S. state of Minnesota. The cabinet-level agency is responsible for maintaining the state's trunk highway system, funding municipal airports and maintaining radio navigation aids, and other activities. It was established in 1976.
Products
Government services.
Scenario
Google business intelligence:
The stakeholder is the Minnesota Department of Transport.
The brief is in creating a business intelligence visualization to help the Minnesota Department of Transportation improve highway infrastructure.
• Interstate traffic volume continues to grow
• There is no end in sight to this
• Infrastructure is limited and needs to be utilised carefully
• Future infrastructure needs to be planned strategically
Problem Statement
The team wants to answer these questions:
- - Traffic volume throughout the year; ideally organized by year, month, -week, day, and hour
- - Traffic volume in different weather conditions
- - Traffic volume on different holidays
Business Case
Knowing traffic patterns under these conditions will help the team make important infrastructure decisions. These decisions will ensure that any construction in the future won’t cause problems for drivers.
Goals/Metrics
The team’s ultimate goal is to optimise infrastructure for traffic.
Dashboard Dataset
The project data consisted of data supplied by the state and dated from 2015 onwards.
Dashboard and results
- Some very specific requests came in. The data was to be from 2017 onwards, with a clear filter and download options.
The chart design guidelines were laid out as follows:
- - Chart 1: Traffic Volume and Date Time
- - Chart 2: Traffic Volume, Date Time, and Weather Main
- - Chart 3: Traffic Volume, Date Time, and a custom measure for Holidays
The traffic analysis covered 3 areas:
• Monthly volumes with an annual benchmark
• Weather effects
• Holiday travel spikes
Results
• Upgrades and repairs to roads need to be carried out at low traffic cycles in winter in all conditions apart from snowy periods. A surprise result of the data was that despite annual data showing that snowy periods have low traffic, the winter month level data shows that it does not deter drivers. Storms, rain, fog, haze and drizzle do however deter drivers.
• High density months require all lanes and exits/entrances. This is August, spring and fall.
• Further research into snowy months and effects on traffic – particularly the Jan/Feb drop off.
• Not all holidays have the same effects. Some major holidays see interstate travel after or before, these are Christmas and Thanksgiving, people want to either be with their families or are taking local roads. Labor Day, MLK Day and Memorial Day are the biggest traffic causers, along with Independence Day and New Year’s.
See the results in this presentation.
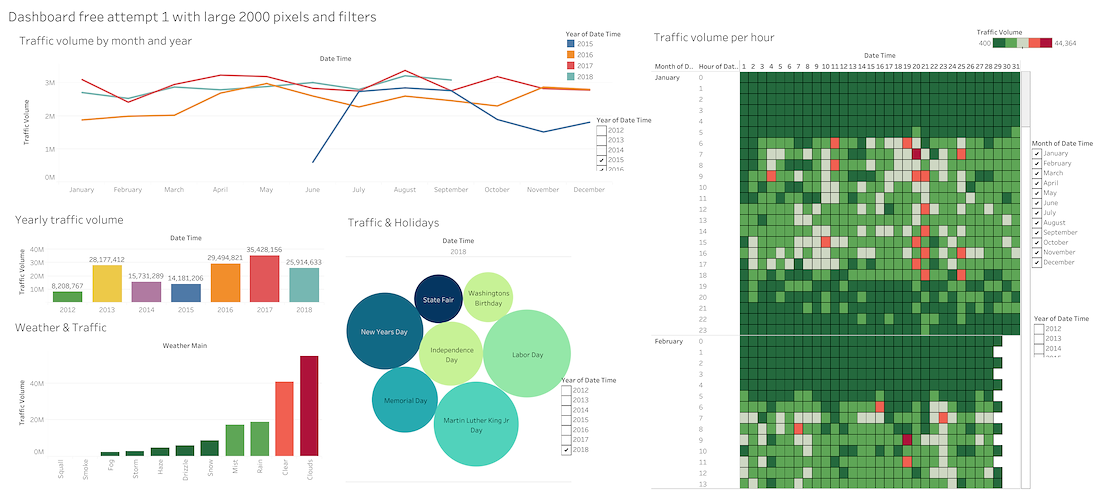
Transport 1st implementation, larger version and full year sets. Highlight markers for the hours volume on the right. This was good but oversized and unpractical. Each chart has a filter. This was replaced later with 1 filter for all by month,
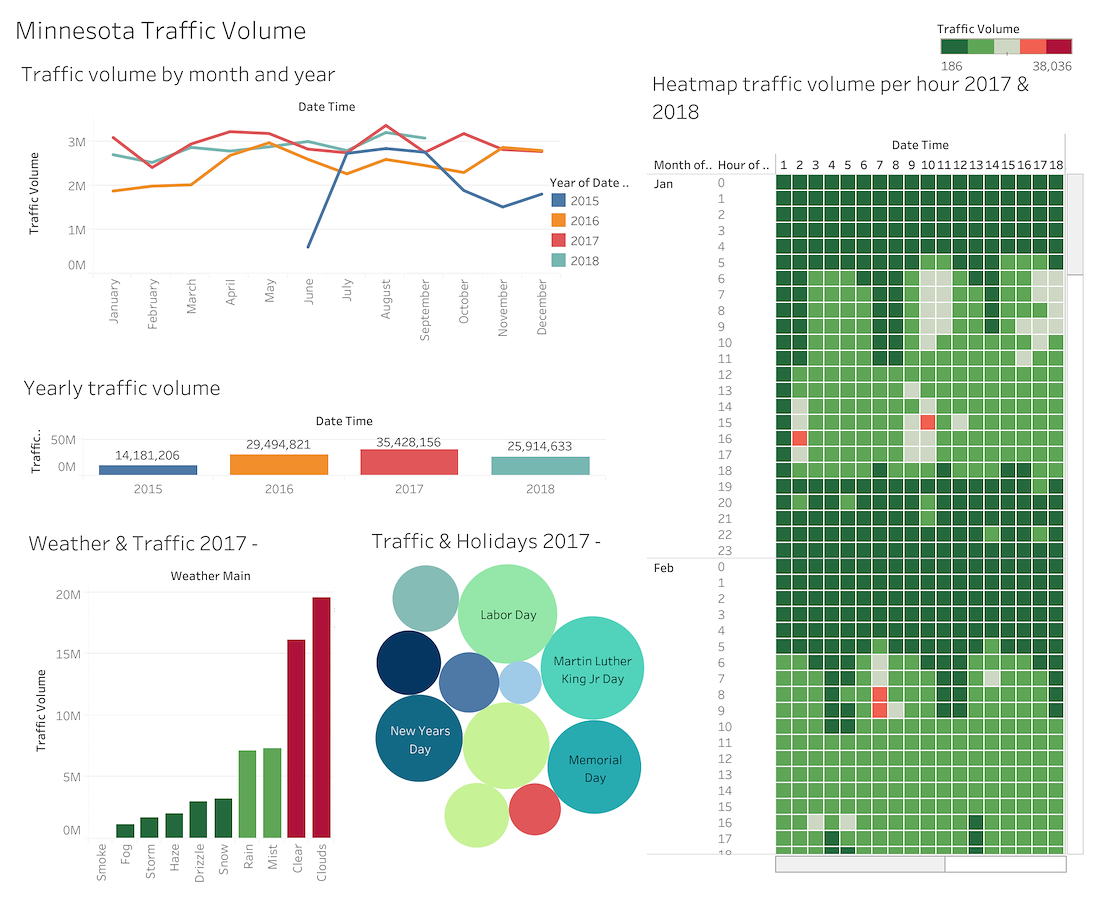
Second version. Heatmap markers for the hours volume on the right, allowing a tighter dashboard.
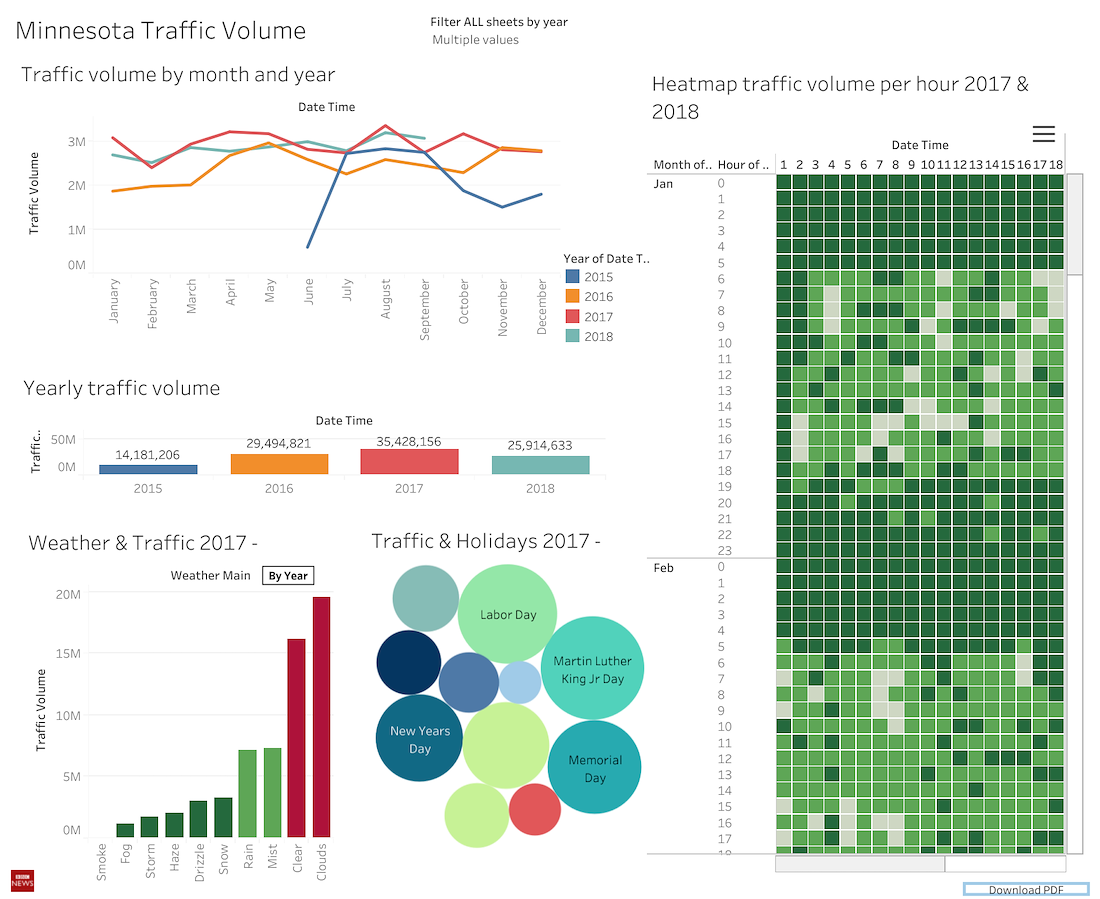
Year sets reduced to 2015 – Filters in place. Links to the year overview.
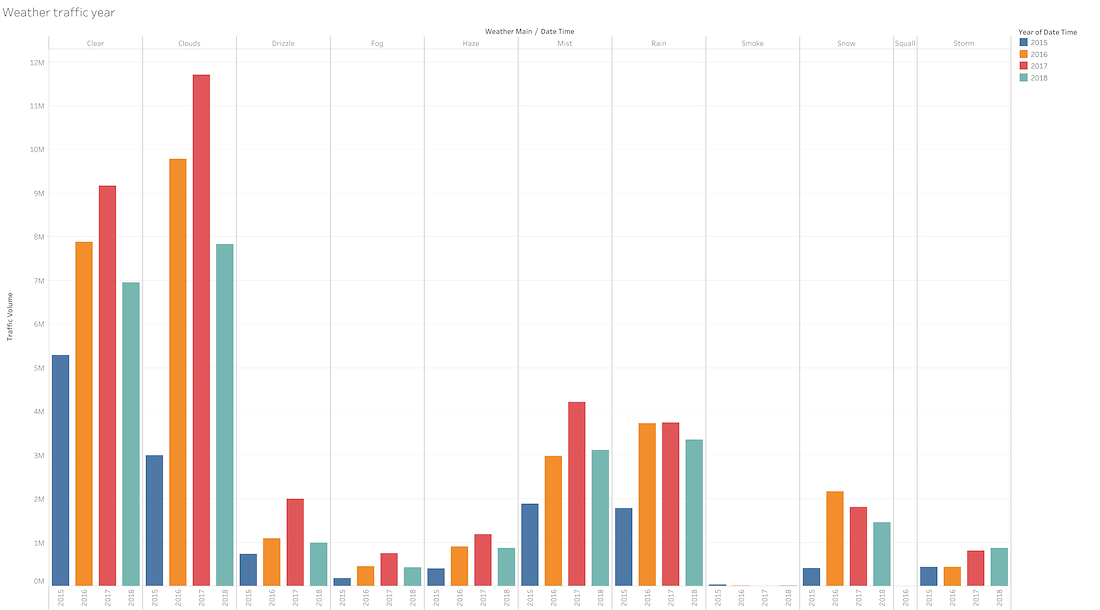
Weather traffic year sheet linked to the front page. This is available on click for the annual view.
Athens Accommodation
Background
About the company
An accommodation business that purchases properties in an
area, converts them into rentals, and offers them to people on vacation in
Athens, Greece.
Products
Athenian holiday accommodation
Scenario
Find data insights on accommodation trends. Airbnb data is the starting point.
Problem Statement
Answer these questions
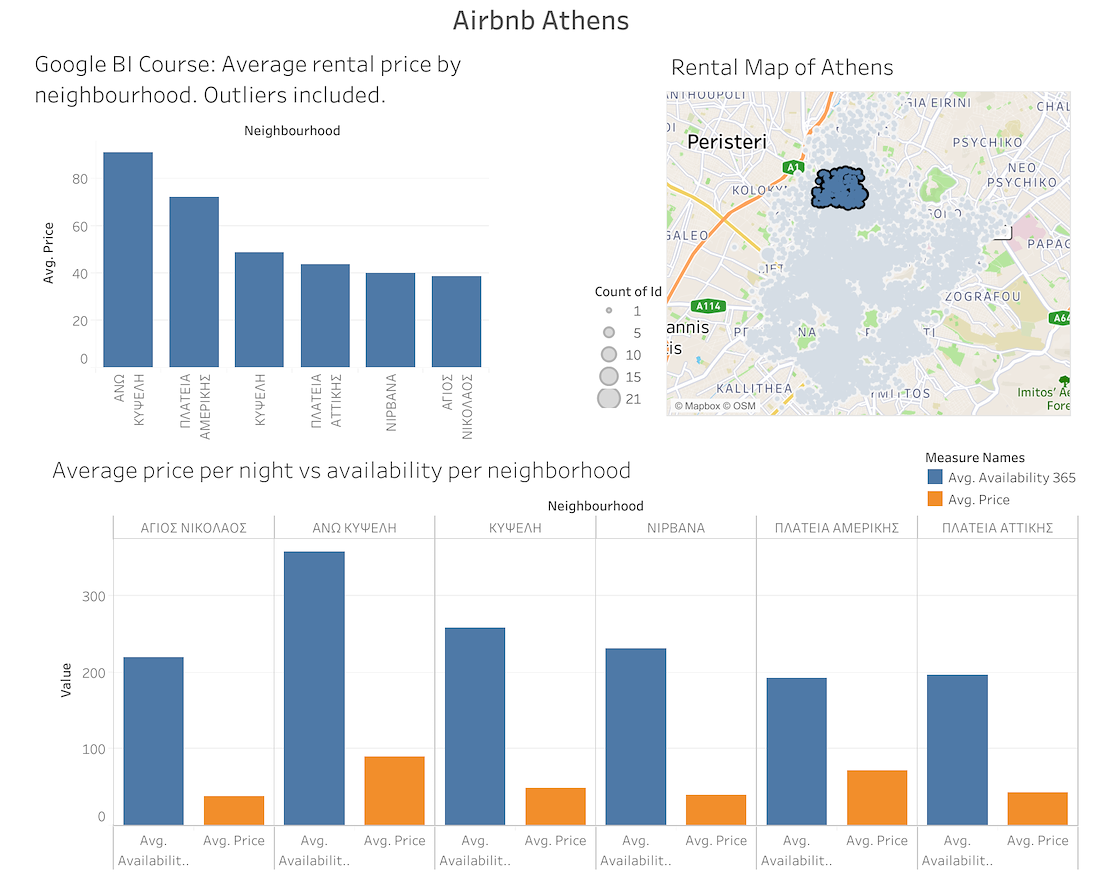
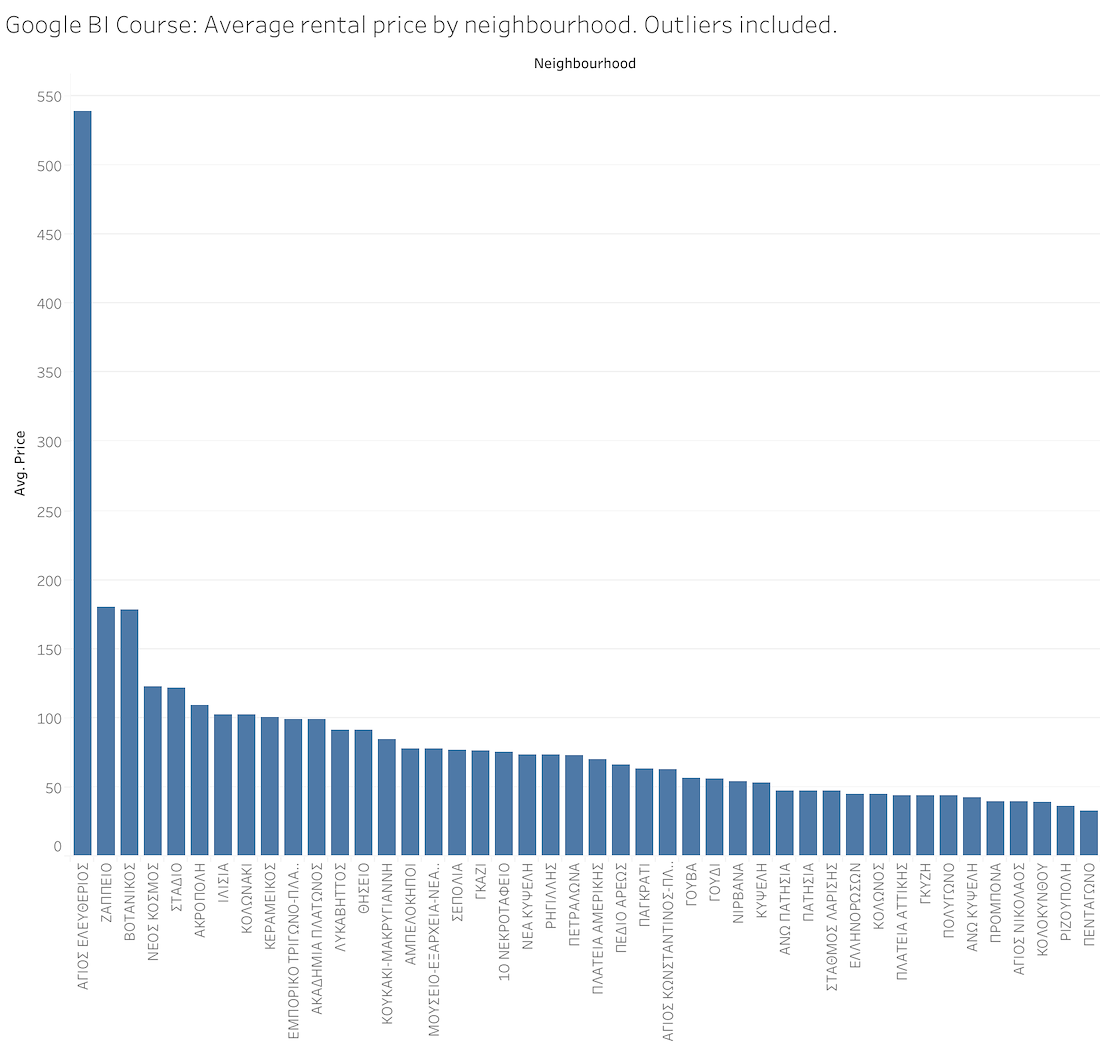
- - What is the average price per night in each neighbourhood?
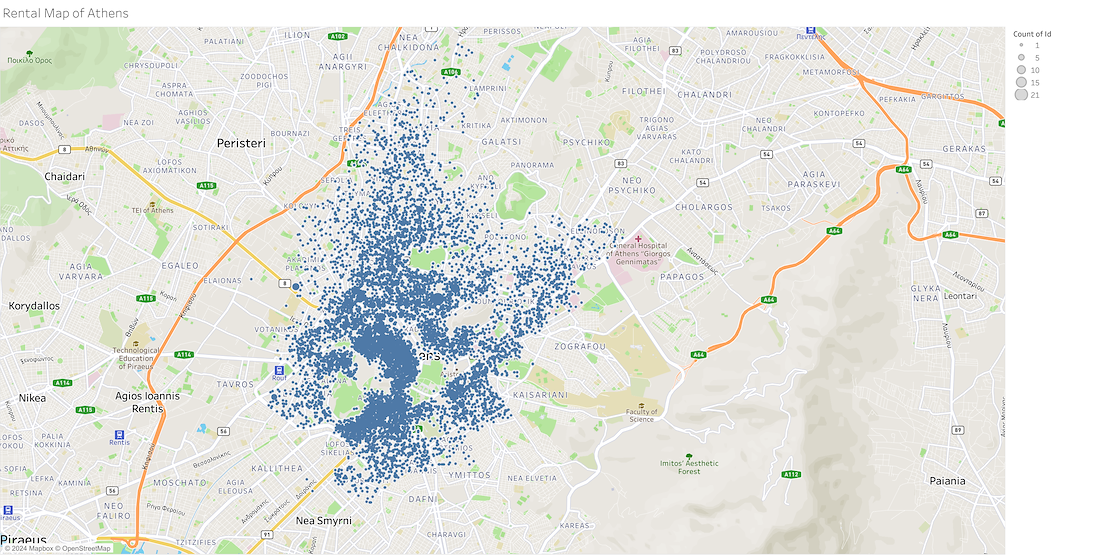
- - Where in Athens are the highest concentrations of currently-available rentals?
Business Case (what are you
solving for)
Buying the right properties and pricing in a smart way to make a profit and enable a portfolio buildout.
Goals/Metrics
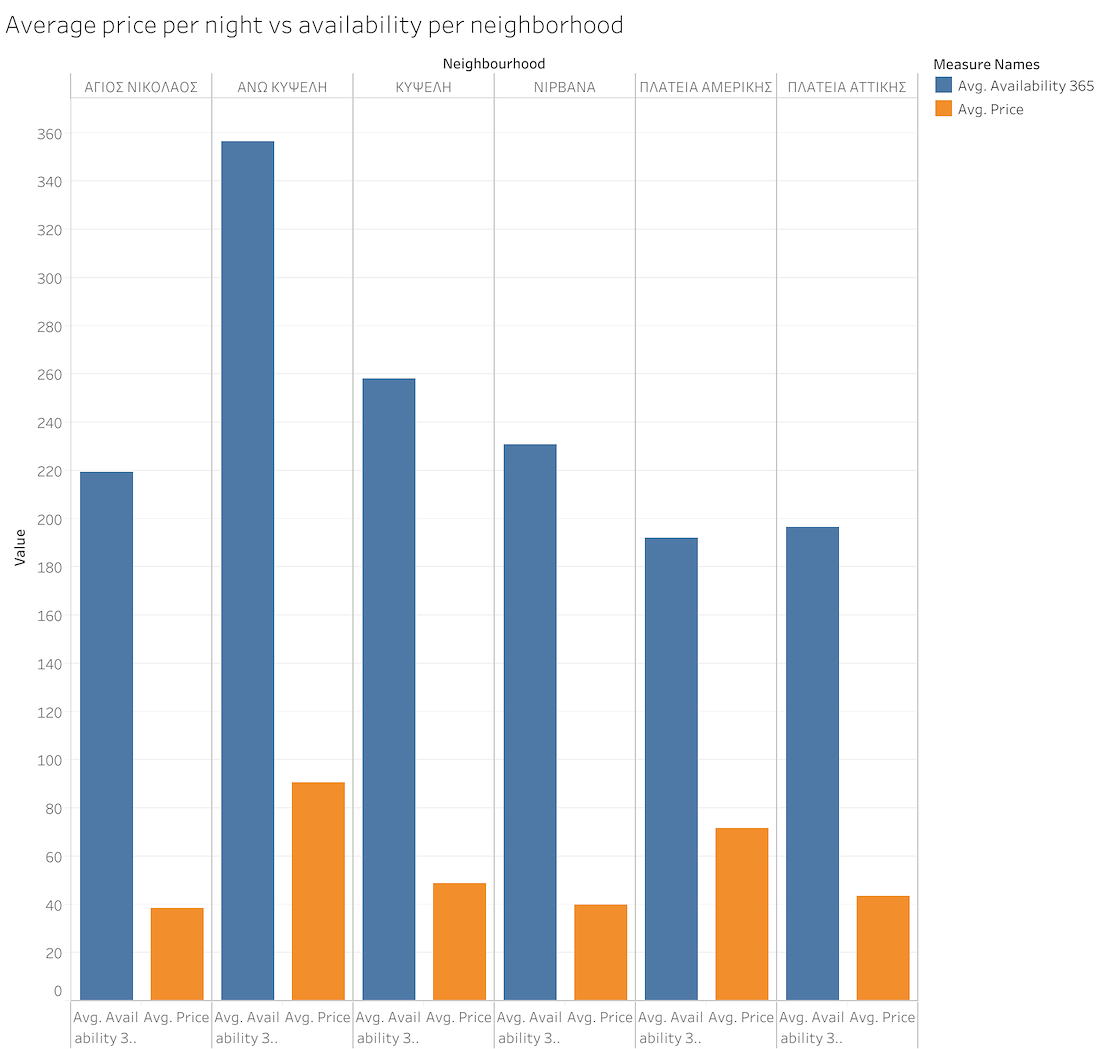
Insights by neighbourhood and by accommodation type. Vacancy rates. Price vs availability. Simple easy graphs and map intelligence.
Dataset/results
Your contact gives you some recent data from Airbnb about the
rentals in the city. This data includes the price to stay at each listing, the
durations of each stay, the locations of these rentals, and more.
Some areas were massively more expensive than others. This outlier was left in as it provides the most interesting information.
There was useful information about where the hotspots are and the filters made it easy to get key pricing and availability trends.
What was not so apparent is any clear link across the board about high prices and high availability. In some neighbourhoods yes, in others no.
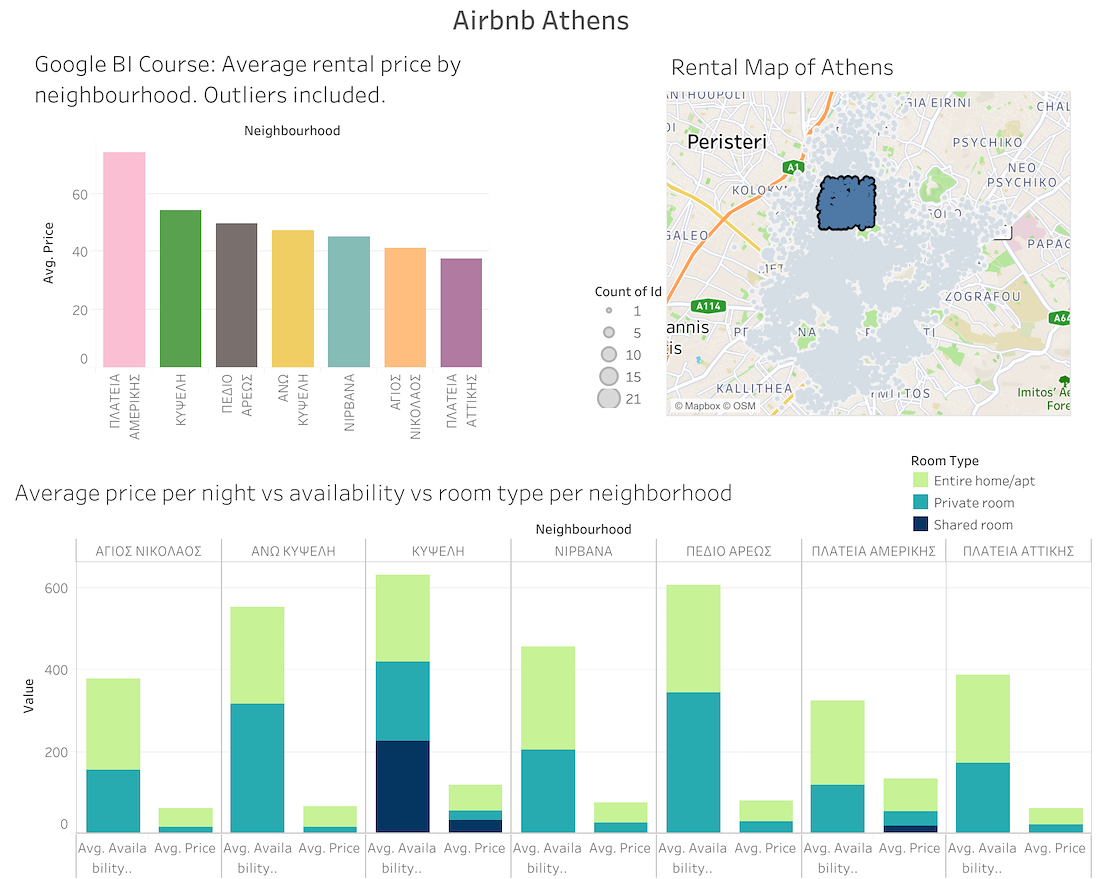
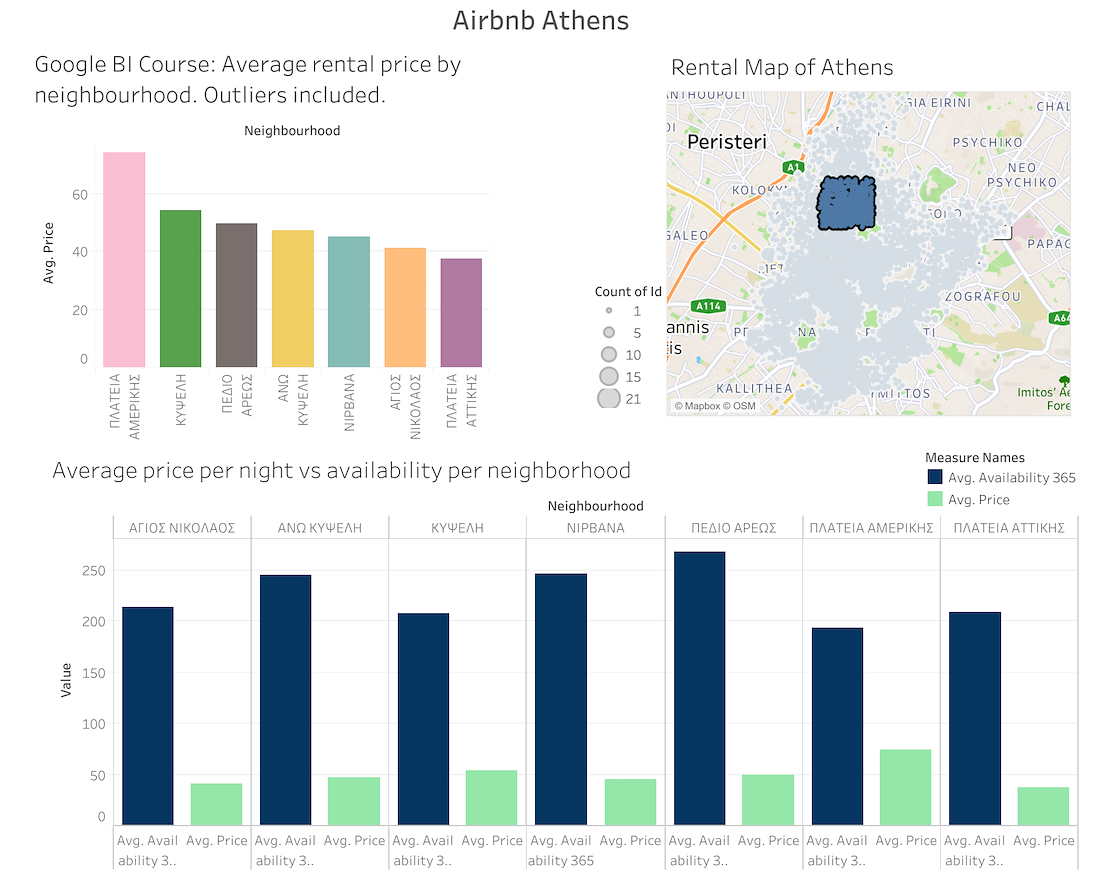
You can use this layout block to write as much or little as you'd like.
You may also paste in embed codes from popular services like Vimeo, SketchFab, and YouTube.
My Journey
Journey
My journey to business intelligence is somewhat different to other students on this course. I originally studied history and the analysis that goes with that, then moved into tourism and tourism information provision. Followed by several years in the UK civil service and intelligence analysis in Berlin for some very big corporations. I worked in marketing for many years and specialised in research analysis, a perfect combination of my several degrees in analysis, business and information management. I also took several course in website management, editing, content, online marketing etc
By the end of the 2010s I decided to join a team working in web admin, community management and weekly email provision. I did that for several years for a major international school and became the team leader. This was very enjoyable and involved a lot of quick reaction web work, content management and graphics. When the chance arose to take a data course I immediately knew that it was a great way for me to add a lot to my skill set and specialise in design. It has been a real eye opener.
I have been able to use my previous research analysis skills to look very deeply at competitor research and my previous postgrad masters experience in interviewing people and getting results to here deal with the different research parts of this project.
I will now be looking to use my skills in a job in data, intelligence work and marketing.
Data is something that is really exciting is an opportunity to stretch oneself in all sorts of new directions.
Attributions
Attributions
Eugene Golovesov on Unsplash
Erol Ahmed on Unsplash
Under construction pictures attributed on the UX Project page with thanks
Awards
- It’s Nice That
- AIGA
- Fonts In Use
- The Dieline
Contact
email@domain.com
000-000-000